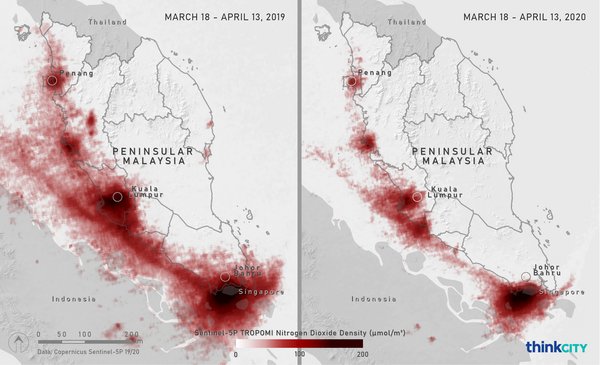


| Caption | These maps show the nitrogen dioxide (NO2) levels in Peninsular Malaysia during March 18-April 13, 2019 (left) and March 18-April 13, 2020 (right). The maps where produced by Think City from spectrometry data obtained from Copernicus Sentinel-5P European Space Agency satellite. |
| Source | Think City |
| Download | |
| Related Press Releases Links |
Think City: Clear Skies as Nitrogen Dioxide Levels Decrease Due to MCO Think City: Langit Cerah apabila Paras Nitrogen Dioksida Berkurang Ekoran PKP |